Housing Reports
December 2025

Summary
The median price of a detached home in the Coachella Valley ended December at $660,000, which is a change of -0.8% from last year. The median price of attached homes ended the month at $460,000, which is a change of -3.0%. Year over year price changes in the average size detached home range from 35.6% in Indian Wells to -9.8% in Coachella. In the average size attached home, changes range from 7.1% in Indio to -10.3% in Desert Hot Springs.
Click on the graphs and charts below for the full report and a larger detailed view
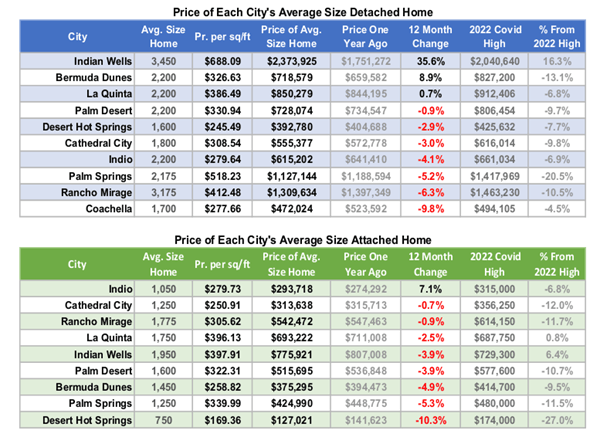
Price of The Average Size City Home
These two tables display the price and price per square foot of the average size home in each city. The median price per sq. ft. in the third column is calculated over the last three months. This is multiplied by the average size home to produce a price, which is compared to the price a year ago. Changes in the average size detached home in each city range from a change of 35.6% in Indian Wells to -9.8% in Coachella. In attached homes changes range from 7.1% in Indio to -10.3% in Desert Hot Springs.
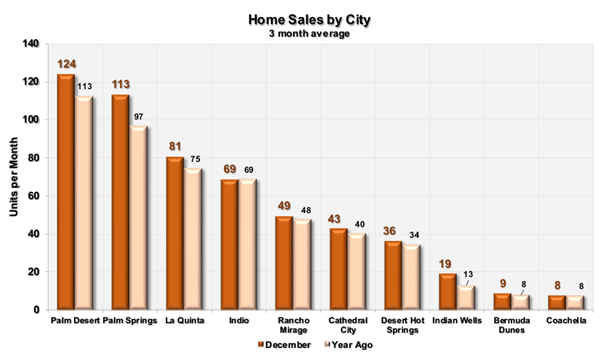
Home Sales by City
Sales by city are ranked left to right by highest average sales. Palm Desert has the highest unit sales at 124 followed by Palm Springs with 113, then La Quinta with 81. Coachella has the lowest average sales at 8 units a month.
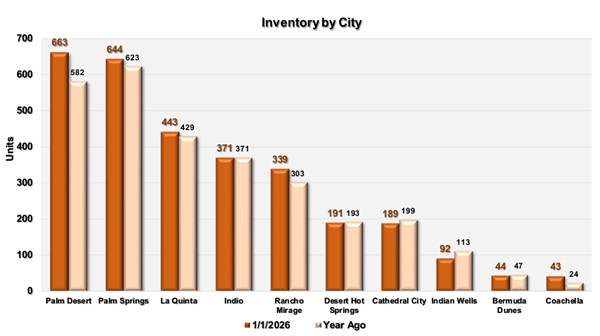
Inventory by City
This chart ranks Coachella Valley cities left to right by highest number of homes for sale. The orange bars are current listings, while the lighter colored bars are last year’s number. The city with the largest inventory is Palm Desert with 663 units, followed by Palm Springs with 644. This chart helps agents know what cities have homeowners with the greatest selling interest and how it compares to last year.
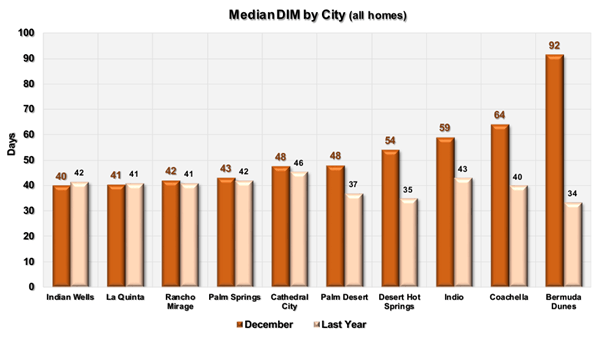
“Days in the Market” by City
This graph compares the median number of “days in the market” in each city to their ratios a year ago. The number includes both detached and attached homes. We have sorted the cities left to right by lowest number of days. Indian Wells has the lowest average selling time at just 40 days. This is followed by La Quinta at 41 days. Bermuda Dunes has the highest median selling time at 92 days.
Price Discount by City
This shows the average price discount for detached homes in each city to their ratios a year ago. We have sorted the cities left to right by lowest discount. In general, cities with higher priced homes sell at larger discounts. The city of Desert Hot Springs has the best premium/discount at -1.0%, while Bermuda Dunes has the most extreme premium/discount of -5.4%.
November 2025
November 2025
Summary
The median price of a detached home in the Coachella Valley ended November at $644,776, which is a change of -0.8% from last year. The median price of attached homes ended the month at $419,000, which is a change of -6.3%. Year over year price changes in the average size detached home range from 17.0% in Indian Wells to -5.2% in Cathedral City. In the average size attached home, changes range from -2.4% in Indian Wells to -16.6% in Bermuda Dunes.
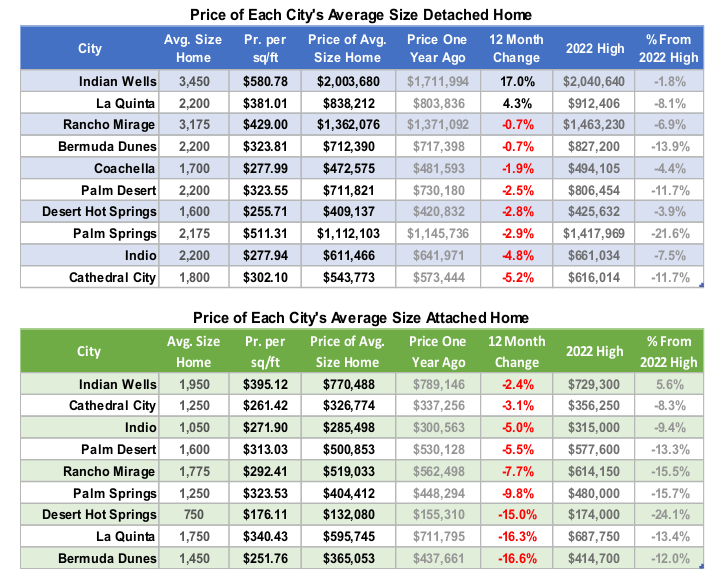
Price of The Average Size City Home
These two tables display the price and price per square foot of the average size home in each city. The median price per sq. ft. in the third column is calculated over the last three months. This is multiplied by the average size home to produce a price, which is compared to the price a year ago. Changes in the average size detached home in each city range from a change of 17.0% in Indian Wells to -5.2% in Cathedral City. In attached homes changes range from -2.4% in Indian Wells to -16.6% in Bermuda Dunes.
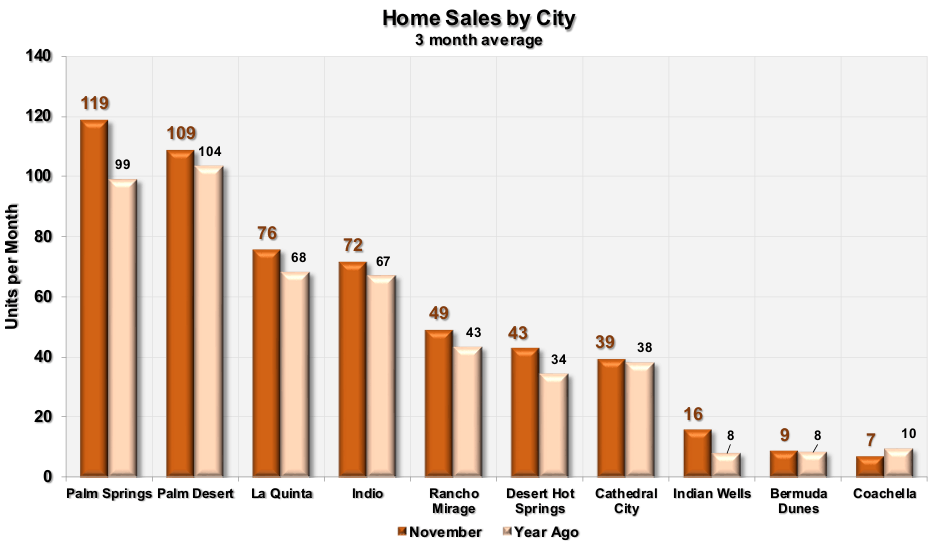
Home Sales by City
Sales by city are ranked left to right by highest average sales. Palm Springs has the highest unit sales at 119 followed by Palm Desert with 109, then La Quinta with 76. Coachella has the lowest average sales at 7 units a month.
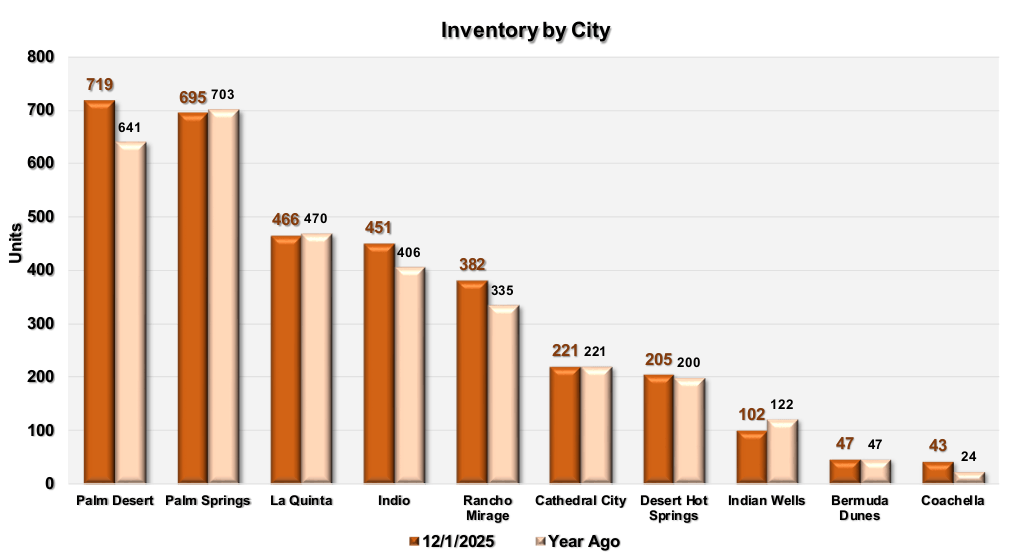
Inventory by City
This chart ranks Coachella Valley cities left to right by highest number of homes for sale. The orange bars are current listings, while the lighter colored bars are last year’s number. The city with the largest inventory is Palm Desert with 719 units, followed by Palm Springs with 695. This chart helps agents know what cities have homeowners with the greatest selling interest and how it compares to last year.
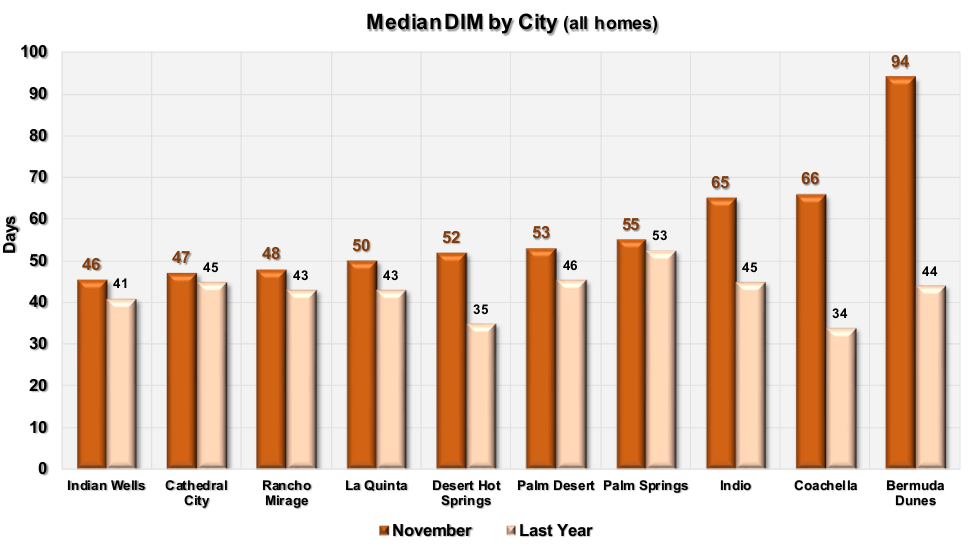
“Days in the Market” by City
This graph compares the median number of “days in the market” in each city to their ratios a year ago. The number includes both detached and attached homes. We have sorted the cities left to right by lowest number of days. Indian Wells has the lowest average selling time at just 46 days. This is followed by Cathedral City at 47 days. Bermuda Dunes has the highest median selling time at 94 days.
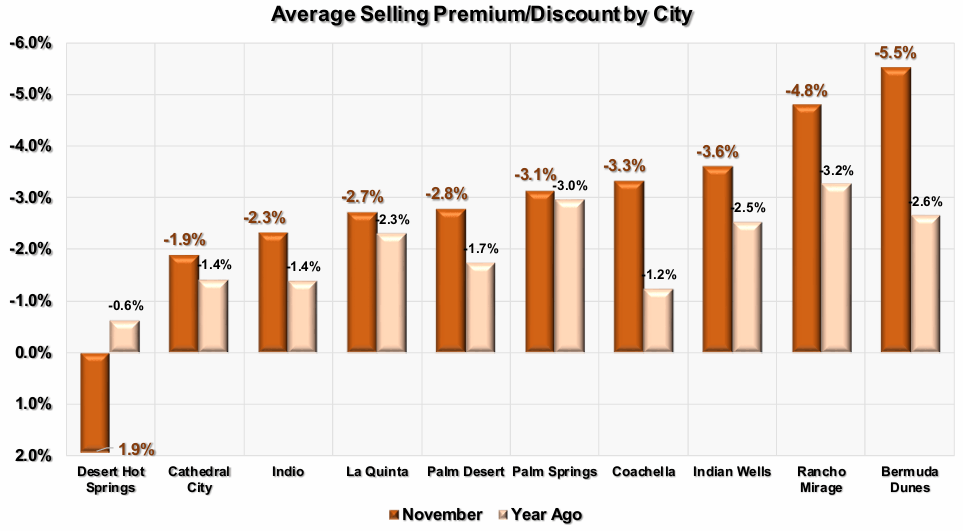
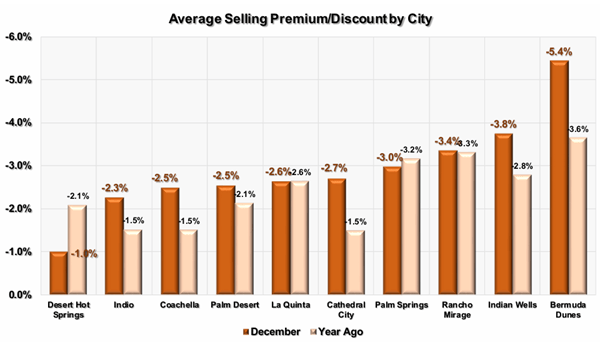
Price Discount by City
This shows the average price discount for detached homes in each city to their ratios a year ago. We have sorted the cities left to right by lowest discount. In general, cities with higher priced homes sell at larger discounts. The city of Desert Hot Springs has the best premium/discount at 1.9%, while Bermuda Dunes has the most extreme premium/discount of -5.5%.
October 2025
Summary
The median price of a detached home in the Coachella Valley ended October at $625,000, which is a change of -1.6% from last year. The median price of attached homes ended the month at $420,000, which is a change of -2.2%. Year over year price changes in the average size detached home range from 2.2% in Cathedral City to -16.5% in Indian Wells. In the average size attached home, changes range from 0.9% in Rancho Mirage to -20.4% in La Quinta.
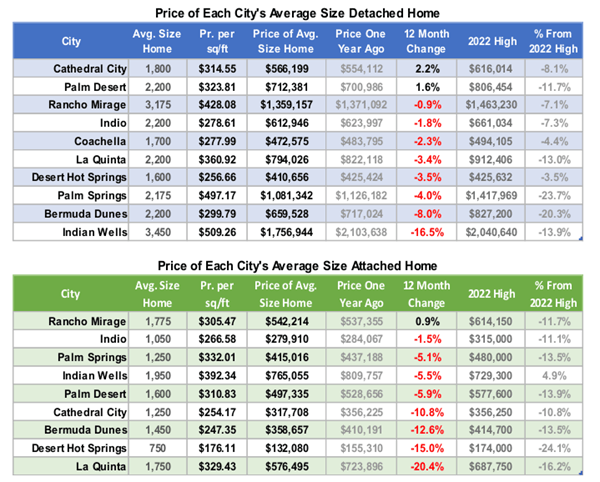
Price of The Average Size City Home
These two tables display the price and price per square foot of the average size home in each city. The median price per sq. ft. in the third column is calculated over the last three months. This is multiplied by the average size home to produce a price, which is compared to the price a year ago. Changes in the average size detached home in each city range from a change of 2.2% in Cathedral City to -16.5% in Indian Wells. In attached homes changes range from 0.9% in Rancho Mirage to -20.4% in La Quinta.
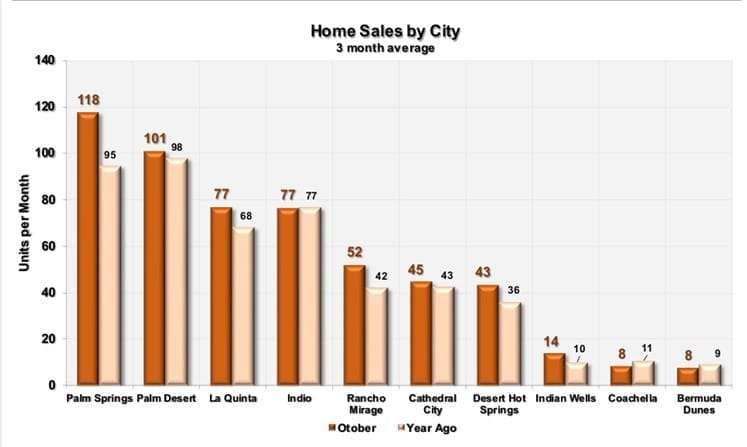
Home Sales by City
Sales by city are ranked left to right by highest average sales. Palm Springs has the highest unit sales at 118 followed by Palm Desert with 101, then La Quinta with 77. Bermuda Dunes has the lowest average sales at 8 units a month.
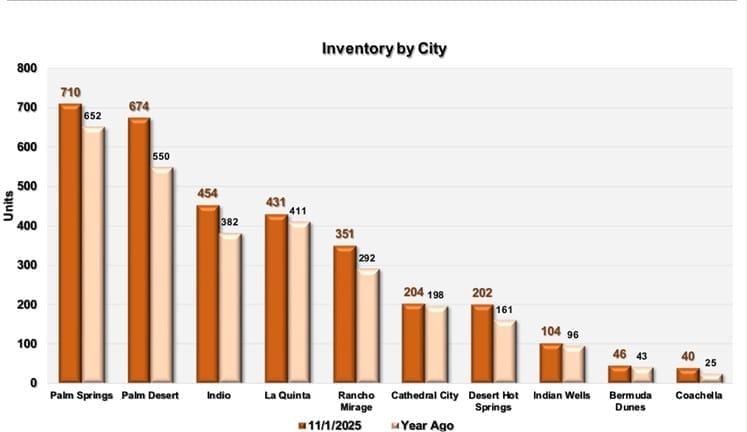
Inventory by City
This chart ranks Coachella Valley cities left to right by highest number of homes for sale. The orange bars are current listings, while the lighter colored bars are last year’s number. The city with the largest inventory is Palm Springs with 710 units, followed by Palm Desert with 674. This chart helps agents know what cities have homeowners with the greatest selling interest and how it compares to last year.
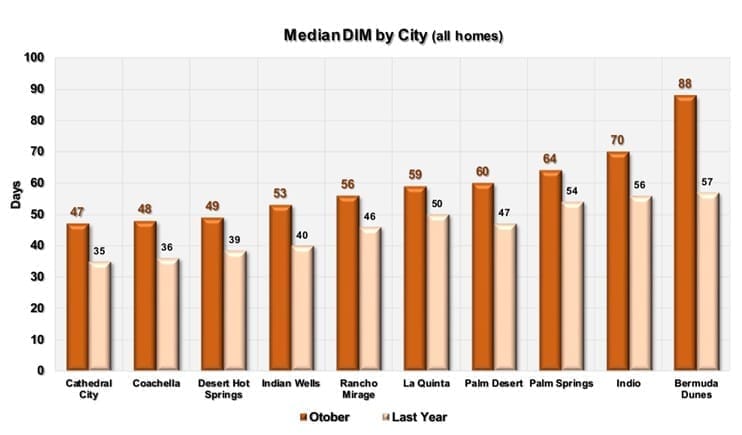
“Days in the Market” by City
This graph compares the median number of “days in the market” in each city to their ratios a year ago. The number includes both detached and attached homes. We have sorted the cities left to right by lowest number of days. Cathedral City has the lowest average selling time at just 47 days. This is followed by Coachella at 48 days. Bermuda Dunes has the highest median selling time at 88 days.
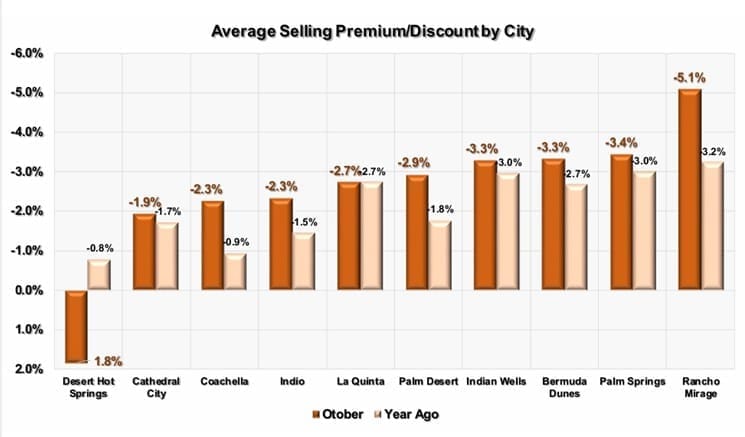
Price Discount by City
This shows the average price discount for detached homes in each city to their ratios a year ago. We have sorted the cities left to right by lowest discount. In general, cities with higher priced homes sell at larger discounts. The city of Desert Hot Springs has the best premium/discount at 1.8%, while Rancho Mirage has the most extreme premium/discount of -5.1%.
Curated market and property insights and sales for Palm Springs, Palm Desert, Rancho Mirage, La Quinta, Indian Wells, Indio, and the greater Coachella Valley.
Curated market and property insights and sales for Palm Springs, Palm Desert, Rancho Mirage, La Quinta, Indian Wells, Indio and the greater Coachella Valley.
@ 2026 Desert Luxury Houses, Tracy Scott DRE# 00957686, RE/MAX Desert Properties DRE# 02038283.
All rights reserved. Terms of Use/Privacy Policy/Equal Opportunity Housing/Fair Housing.
© 2026 Desert Luxury Houses, Tracy Scott DRE# 00957686, RE/MAX Desert Properties DRE# 02038283.
All rights reserved. Terms of Use/Privacy Policy/Equal Opportunity Housing/Fair Housing.
Create Your Free Account